
Introduction
In order to check the randomness of numbers generated by a RNG (Random Number Generator), either pseudoRNG or trueRNG, is to use statistical tests such as those provided by the well known dieharder or NIST Test Suite.
Nevertheless, human are also good at detecting patterns in graphics and therefore, it is also insteresting to use graph to check that these data are evenly distributed.
This document describes how to represent random numbers using 3 kinds of graphics: Cartesian coordinates (x,y,z), Polar coordinates (r,θ) and spherical coordinates (r,θ,φ).
To keep a readable graph, you shouldn’t plot more than 3 000 plots (you can plot several graphs from the same RNG flow in order to plot more data).
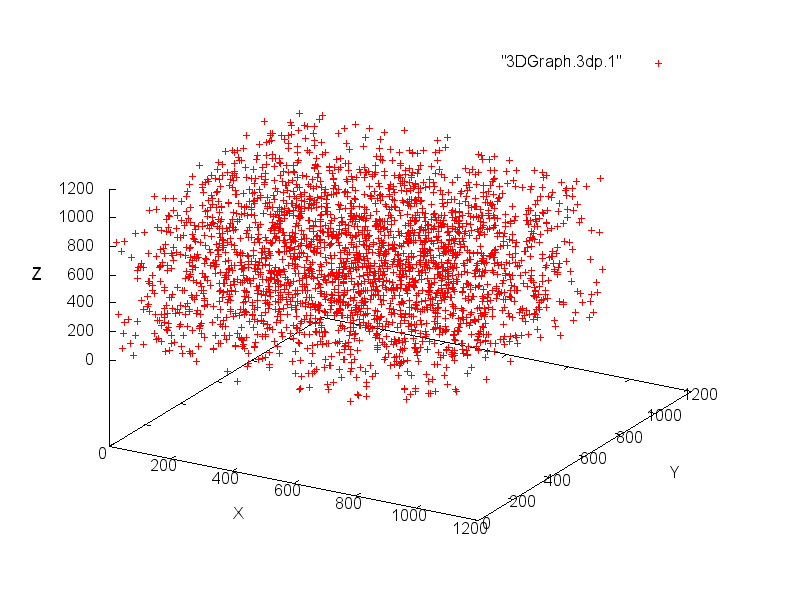
Plotting random numbers using Cartesian coordinates
With this coordinate system, we must extract 3 coordinates (x, y, z) from the random numbers flow for each point to plot.
If we want to plot the graph in a range of [0,1024] for each coordinate, we have to extract 10 bits for each coordinate.
Therefore, we extract 30 bits from the flow for each point and convert them as follow:
x = 1st 10 bits block
y = 2nd 10 bits block
z = 3rd 10 bits block
To plot the result with gnuplot, we create a text file with one line for each point and each coordinate separated by a space.
This file looks like this:
991 230 301
361 907 269
627 602 666
529 381 299
We can then create the graph with the following command:
gnuplot <<- EOF
set xlabel “X”
set ylabel “Y”
set zlabel “Z”
set terminal png size 800,600
set output “PNG/3dGraph.png”
splot “3DGraph.3dp.1” with points
EOF
I’ve written a Java program in order to create the text file with the cartesian coordinates.
It takes 4 arguments:
– Number of plots to generate
– File containing the random data (binary format – unsigned int)
– Filename to create (the extension .[FileNumber] will be added)
– Number of files to create
For instance: $ java gen3DPlotsXfiles 2500 randomSHA1BufferedBytes.bin 3DGraph.3dp 3
You can download it there (source code).
Plotting random numbers using polar coordinates
With this coordinate system, we must extract 2 coordinates (r,θ) from the random numbers flow for each point to plot.
We extract 32 bits from the flow for each point and we use the 1st 16 bits block to compute r and the 2nd 16 bits block to compute θ. θ must be between 0 and 2π and we have to reduce r in order to have a readable graph:
r = √(1st 16 bits block)
θ = 2π * (2nd 16 bits block / 65535)
We use cartesian coordinates to represent the polar graph and we use the following formula to get (x,y):
x = r cos(θ)
y = r sin(θ)
To plot the result with gnuplot, we create a text file with one line for each point and each coordinate separated by a space.
This file looks like this:
-197.44658222052524 156.3740616900174
66.16706534251355 -150.7578172565507
-134.03757053150568 -186.70814038496457
36.92189176532868 65.25161996816136
We can then create the graph with the following command:
gnuplot <<- EOF
set xlabel “X”
set ylabel “Y”
set terminal png size 800,600
set output “PNG/PolarGraph.png”
plot “PolarGraph.pop.trans.1” with points
EOF
![]()
I’ve written a Java program in order to create the text file with the polar coordinates.
It takes 4 arguments:
– Number of plots to generate
– File containing the random data (binary format – unsigned int)
– Filename to create (the extension .[FileNumber] will be added)
– Number of files to create
For instance: $ java genPolairePlotsXfiles 2500 randomSHA1BufferedBytes.bin PolarGraph.pop 3
You can download it there (source code).
Plotting random numbers using sperical coordinates
With this coordinate system, we must extract 3 coordinates (r,θ,φ) from the random numbers flow for each point to plot.
We extract 48 bits from the flow for each point and we use the 1st 16 bits block to compute r, the 2nd 16 bits block to compute θ and the 3rd 16 bits block to compute φ.
θ must be between 0 and 2π, φ must be between 0 and π and we have to reduce r in order to have a readable graph:
r = √(1st 16 bits block)
θ = 2π * (2nd 16 bits block / 65535)
φ = π * (3rd 16 bits block / 65535)
We use cartesian coordinates to represent the spherical graph and we use the following formula to get (x,y,z):
x = r cos(θ) sin(φ)
y = r sin(θ) sin(φ)
z = r cos(φ)
To plot the result with gnuplot, we create a text file with one line for each point and each coordinate separated by a space.
This file looks like this:
-190.21941008097107 150.65027427731468 67.520892238012
70.99000003161079 -193.0874969736593 -105.55869650558883
5.032180727191924 8.893313119187903 74.27372441781117
-231.71131404072872 -26.472840498971532 -97.67320851407925
-31.251397953230708 -75.99695879862513 53.14896404756053
We can then create the graph with the following command:
gnuplot << EOF
set xlabel “X”
set ylabel “Y”
set zlabel “Z”
set terminal png size 800,600
set output “PNG/SphericalGraph.png”
splot “SphericalGraph.spp.1” with points
EOF
![]()
I’ve written a Java program in order to create the text file with the spherical coordinates.
It takes 4 arguments:
– Number of plots to generate
– File containing the random data (binary format – unsigned int)
– Filename to create (the extension .[FileNumber] will be added)
– Number of files to create
For instance: $ java genSpherePlotsXfiles 1666 randomSHA1BufferedBytes.bin SphericalGraph.spp 3
You can download it there (source code).